Improving the performance of my Next.js blog
Introduction
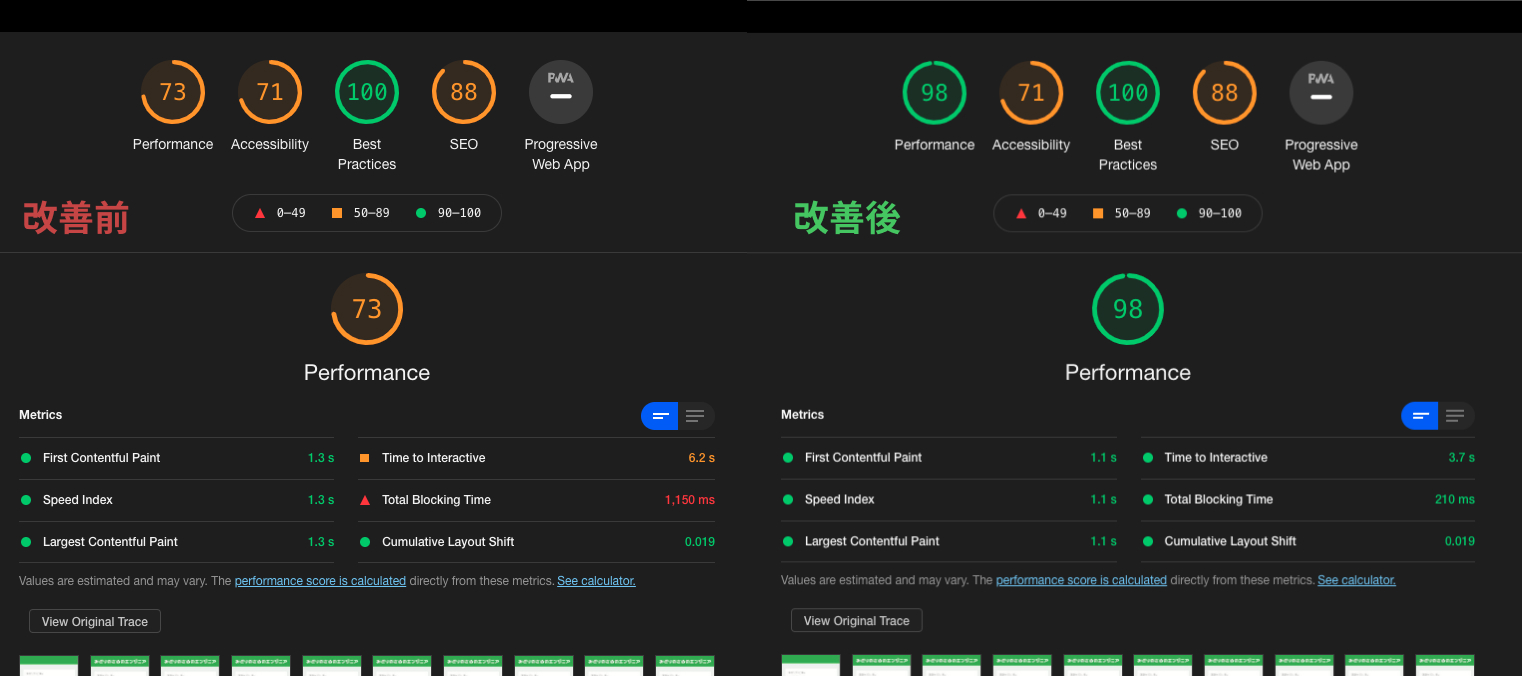
During the year-end holidays, I replaced this tech blog from GatsbyJS to Next.js. As a result, the Lighthouse performance score dropped, so I investigated the cause and made improvements.
Investigating the cause
Analyzing the Lighthouse results
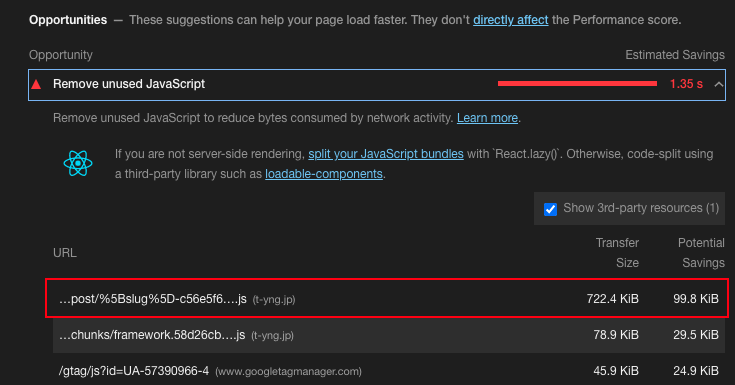
Looking at the Lighthouse details, a very large JS file of 722.4kb was being sent. As shown by "Potential Saving 99.8kb," most of this JS file was unused code.
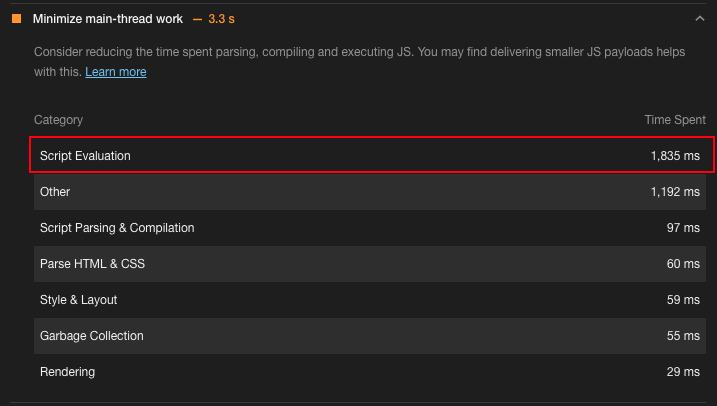
The large JS file also caused "Script Evaluation" to take 1,835ms, blocking rendering for a long time.
Webpack Bundle Analyzer
The large JS file that caused the problem in the Lighthouse results was chunks/pages/post/[slug]-xxx.js. This is a file generated by Next.js's build process for the article detail page. I investigated the modules bundled in this file to find out why it was so large.
Next.js uses Webpack internally for building, so I can use webpack-contrib/webpack-bundle-analyzer to visualize the bundle information of the generated JS files.
A Next.js plugin called @next/bundle-analyzer is available, so I used that.
First, install the package.
$ yarn add -D @next/bundel-analyzerThen add the plugin configuration to next.config.js.
I set it up so that the bundle analyzer only runs when the environment variable ANALYZE=true is set.
const withBundleAnalyzer = require('@next/bundle-analyzer')({
    enabled: process.env.ANALYZE === 'true',
});

const config = {
    // omitted
};

module.exports = withBundleAnalyzer(config);
Run it like this:
$ ANALYZE=true next buildI also added it to package.json for future use.
{
    "scripts": {
        "bundle-analyzer": "ANALYZE=true next build"
    }
}
Analyzing the Webpack Bundle Analyzer results
Running webpack-bundle-analyzer opens a browser during the build with a visualization of the bundle.
Looking at the result, a module called refractor took up most of the space. Loading this module seemed to be the cause of the problem.
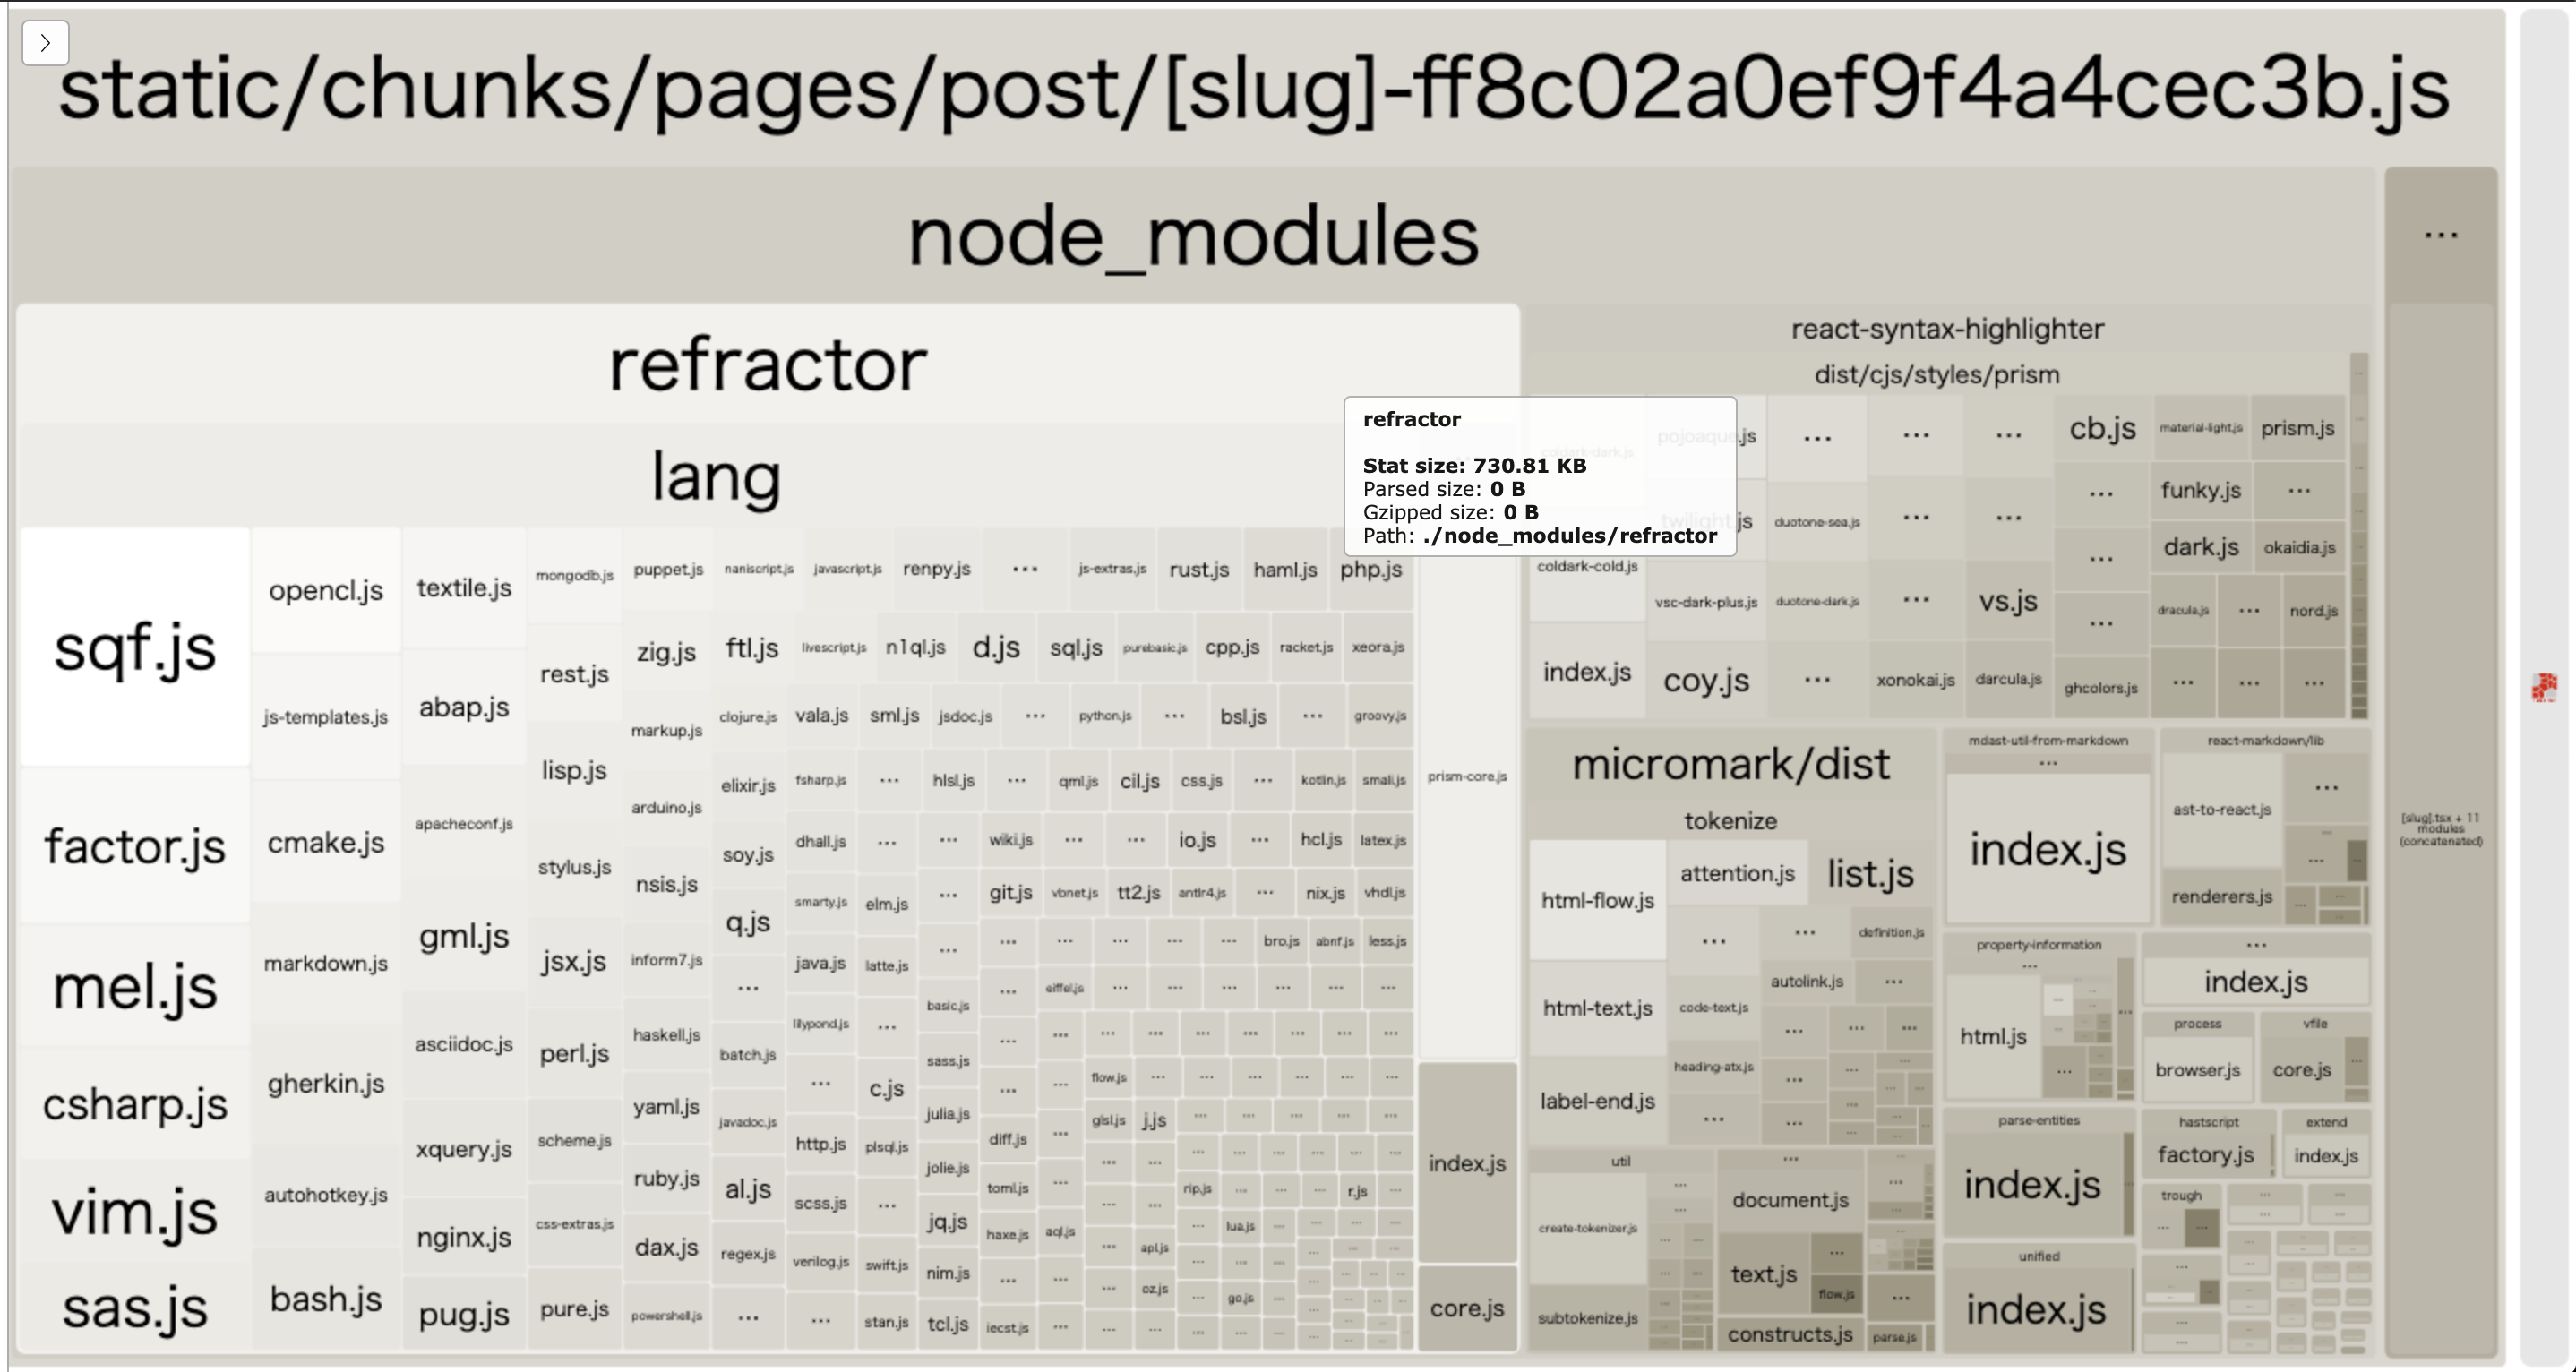
Looking at yarn.lock, I found that refractor is loaded from react-syntax-highlighter/react-syntax-highlighter.
react-syntax-highlighter@^15.4.3:
  version "15.4.3"
  resolved "https://registry.yarnpkg.com/react-syntax-highlighter/-/react-syntax-highlighter-15.4.3.tgz#fffe3286677ac470b963b364916d16374996f3a6"
  integrity sha512-TnhGgZKXr5o8a63uYdRTzeb8ijJOgRGe0qjrE0eK/gajtdyqnSO6LqB3vW16hHB0cFierYSoy/AOJw8z1Dui8g==
  dependencies:
    "@babel/runtime" "^7.3.1"
    highlight.js "^10.4.1"
    lowlight "^1.17.0"
    prismjs "^1.22.0"
    refractor "^3.2.0"
Now that I found the cause of the performance problem, I moved on to fixing it.
Improving performance
refractor includes JS files for each language used in syntax highlighting, and all of them were being loaded at the time of the first render, causing the performance issue. Since react-syntax-highlighter supports dynamic imports, I changed it to use dynamic imports to avoid blocking rendering.
However, the total size of files being loaded didn't change, so I'd like to find a better approach in the future.
// import { Prism as SyntaxHilighter } from 'react-syntax-highlighter';
import { PrismAsync as SyntaxHilighter } from 'react-syntax-highlighter';
After switching to dynamic import, the bundle analyzer shows refractor-import.xxx.js as a new separate chunk. The file size of [slug]-xxx.js was also reduced from 722.4kb to 216.54kb.
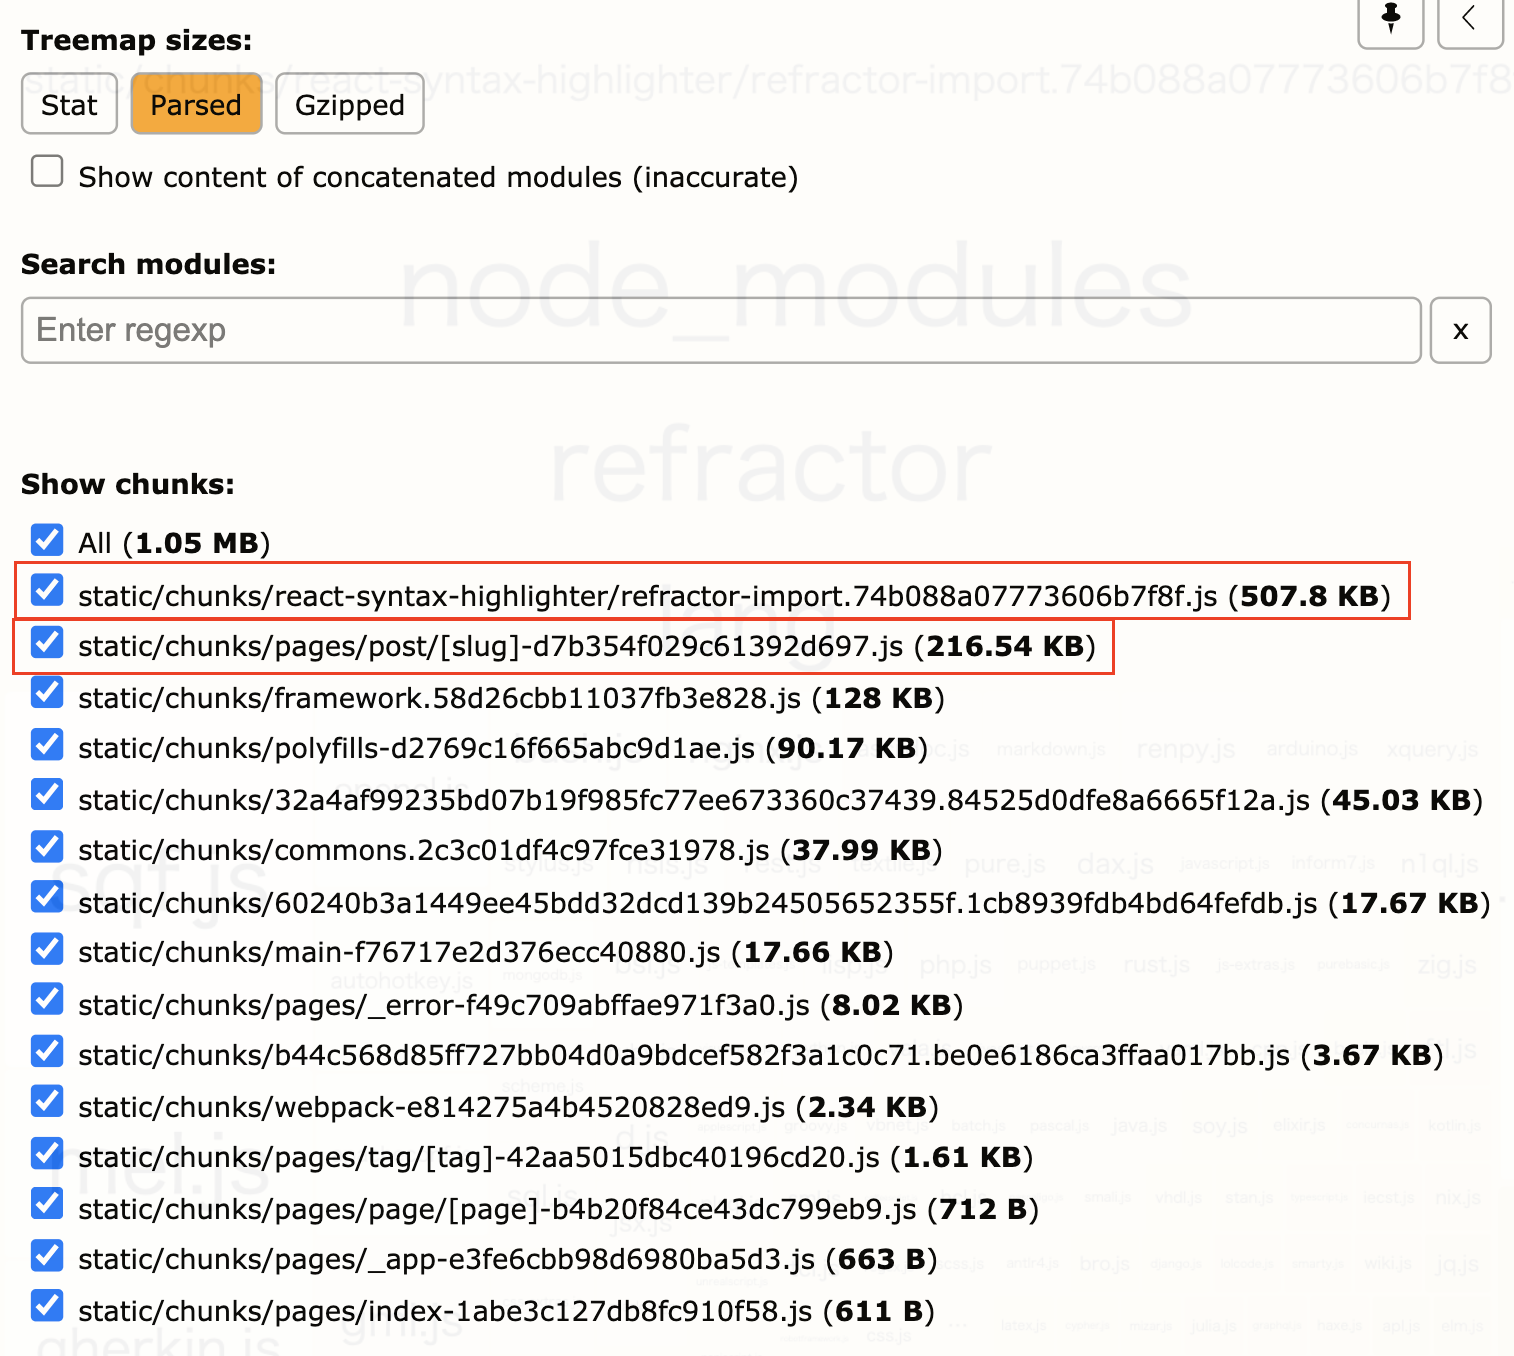
Looking at the contents of the updated [slug]-xxx.js, I found another problem. react-syntax-highlighter was loading all theme files.
![bundle-analyzer result for [slug]-xxx.js](/images/posts/nextjs-perf-improvement/bundle-analyzer-result-slug.png)
This was also unnecessary, so I changed it to load only the theme file I needed.
// import { vscDarkPlus as defaultVscDarkPlus } from 'react-syntax-highlighter/dist/cjs/styles/prism';
import defaultVscDarkPlus from 'react-syntax-highlighter/dist/cjs/styles/prism/vsc-dark-plus';
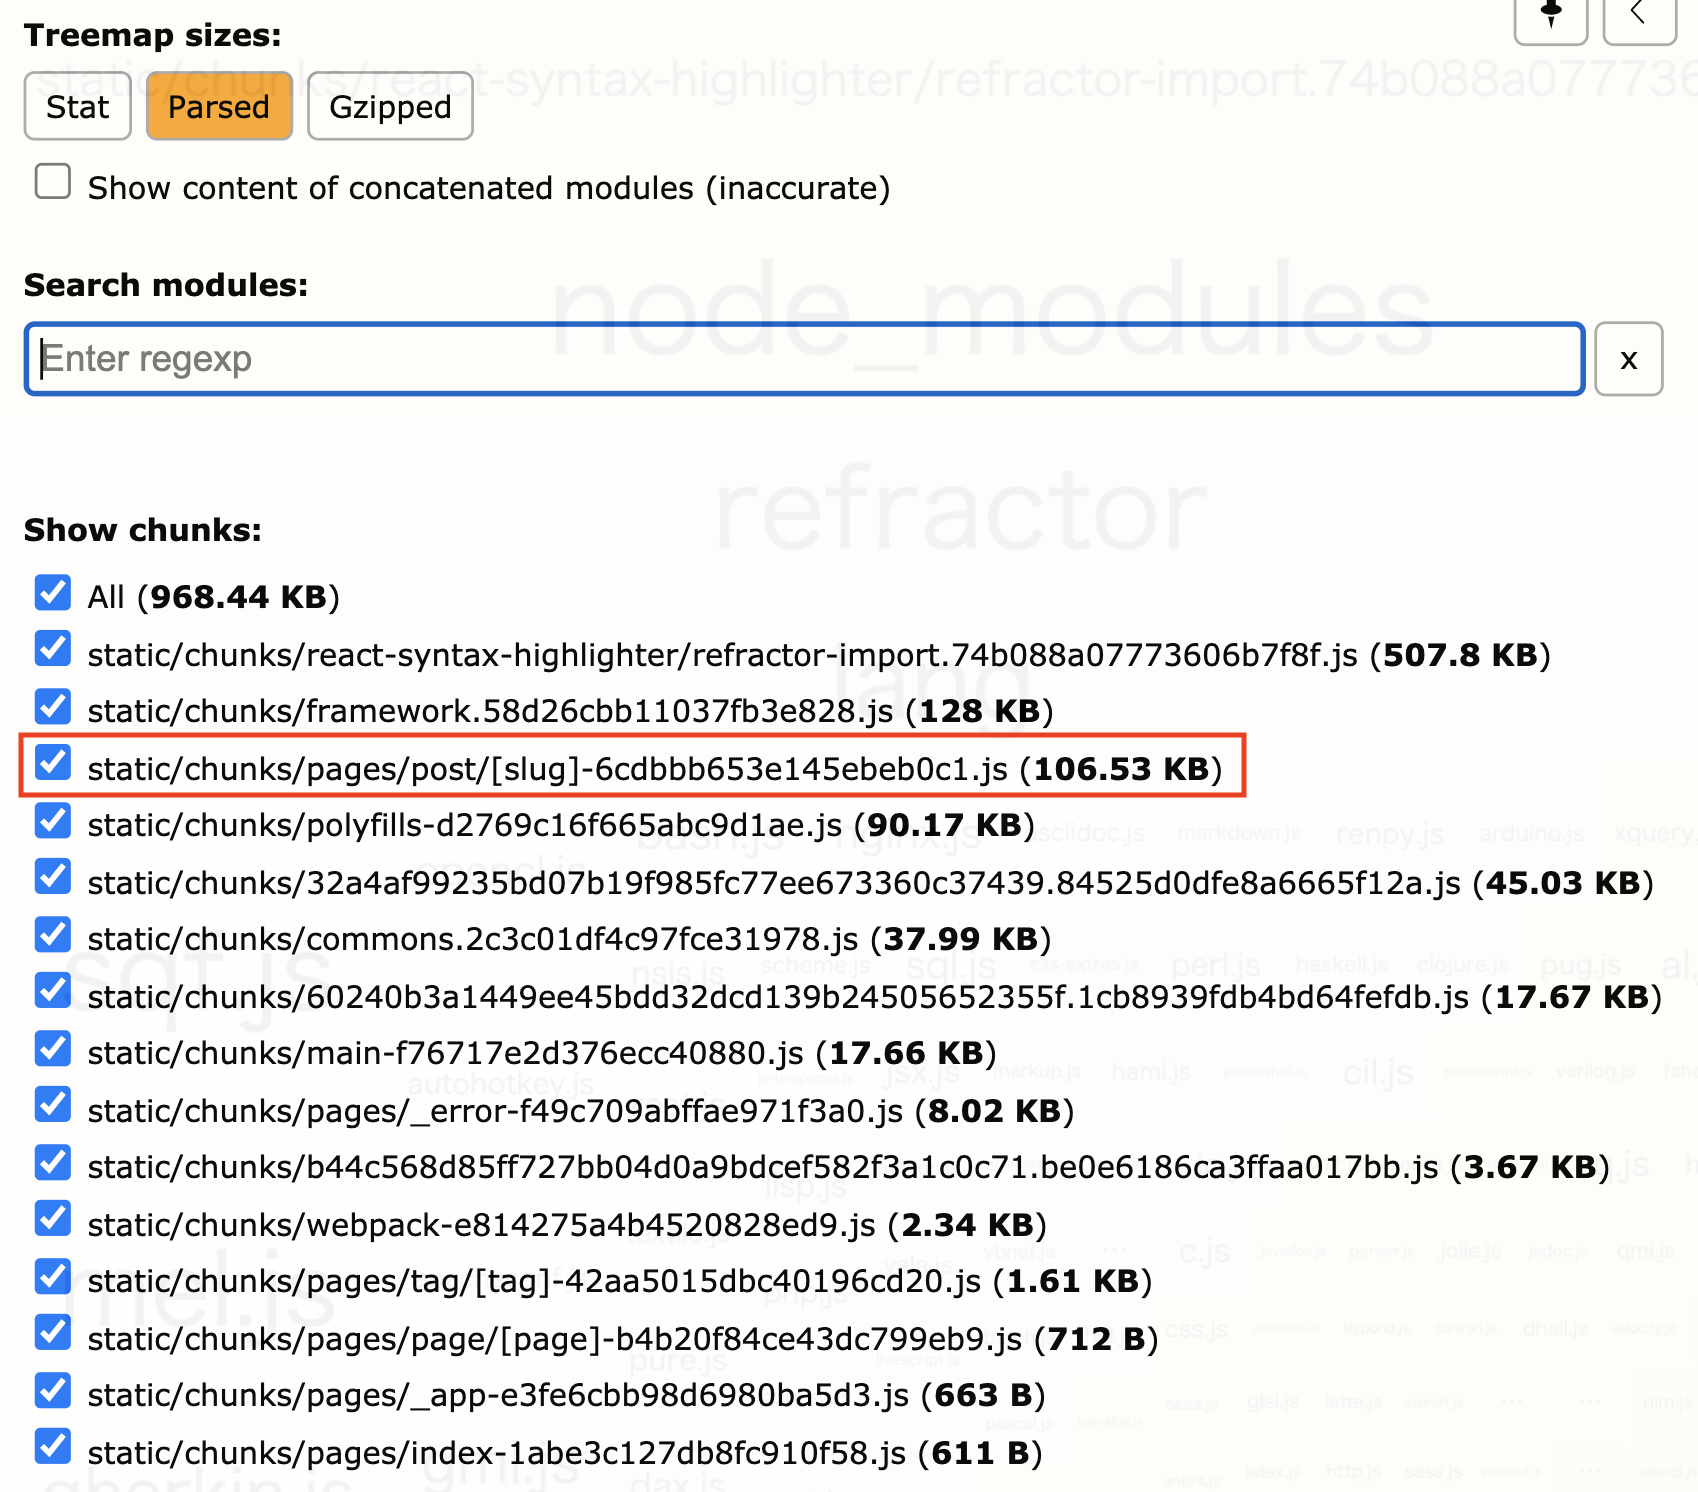
In the end, the file size of [slug]-xxx.js was reduced from 722.4kb to 106.5kb — a 1/7 reduction!
This significantly reduced the rendering blocking time, so the Lighthouse performance score also improved.
Conclusion
This time I focused on the biggest problem and made improvements, but there are still many more things to improve, such as image optimization, lazy loading of images, and removing other unnecessary JavaScript files. Also, the migration to Next.js introduced new libraries that unintentionally caused a performance drop, so I want to set up a system to continuously measure performance going forward, for example using GoogleChrome/lighthouse-ci.