Trying the ISUCON summer course 2017
I worked through ISUCON Summer Course 2017 as practice for ISUCON10. Here I summarize only the basic data collection steps for finding bottlenecks.
Environment setup
I used VirtualBox as the virtual machine and the isucon7 qualifying problem.
# Specify the private network IP address
$ vi Vagrantfile
   # Create a private network, which allows host-only access to the machine
   # using a specific IP.
-  config.vm.network "private_network", ip: "192.168.33.10"
+  config.vm.network "private_network", ip: "192.168.33.10"

# Build the virtual environment
$ git clone https://github.com/matsuu/vagrant-isucon.git
$ cd vagrant-isucon/isucon7-qualifier
$ vagrant up
$ vagrant halt # The app did not start on the image VM on the first boot
$ vagrant up
Run the benchmark
First, check the IP address assigned to the application server VM.
$ vagrant ssh image
$ ifconfig
...
enp0s9    Link encap:Ethernet  HWaddr 08:00:27:4a:09:63
          inet addr:172.28.128.8  Bcast:172.28.128.255  Mask:255.255.255.0
...
Run the benchmark against the confirmed IP address.
$ vagrant ssh bench
$ cd /home/isucon/isubata/bench
$ bin/bench -remotes 172.28.128.8 # Specify the image machine's IP address
[isu7q-bench] 2020/07/26 09:33:46.171614 dataset.go:37: datapath ./data
[isu7q-bench] 2020/07/26 09:33:47.656776 bench.go:472: Remotes [172.28.128.8]
...
[isu7q-bench] 2020/07/26 09:34:02.557313 bench.go:260: Cannot increase Load Level. Reason: RecentErr 2020-07-26 09:34:02.336753948 +0000 UTC m=+16.304791155 Request timed out (POST /message) Before 220.553901ms
Check the application
Open http://192.168.33.10 in your browser to check the app. Since there is no data before running the benchmark, it is recommended to run the benchmark first. You can create a new account and log in.
Connect to MySQL in the virtual environment
Check the SSH config. The MySQL connection info was found in the ansible config file.
$ vagrant ssh-config image
Host image
  HostName 127.0.0.1
  User vagrant
  Port 2222
  ...
  IdentityFile /Users/tomohiro/workspace/isucon/vagrant-isucon/isucon7-qualifier/.vagrant/machines/image/virtualbox/private_key
Connect to MySQL with these settings:
MySQL Host: 127.0.0.1
Username: isucon
Password: isucon
Database: isubata
SSH Host: 192.168.33.10
SSH User: vagrant
Private Key: ~/isucon7-qualifier/.vagrant/machines/image/virtualbox/private_key
Change the implementation language
ISUCON allows you to choose your preferred language from several options. Here I switch to JavaScript (Node.js). I referenced ISUCON7 Qualifying Manual for switching the reference implementation.
# Work on the application server
$ vagrant ssh image

# Check the list of services
$ ls -l /etc/systemd/system/ | grep isubata
-rw-r--r-- 1 root root  331 Jul 26 09:01 isubata.golang.service
-rw-r--r-- 1 root root  363 Jul 26 09:01 isubata.nodejs.service
...
-rw-r--r-- 1 root root  382 Jul 26 09:01 isubata.ruby.service

# Check the currently running implementation
vagrant@ubuntu-xenial:~$ systemctl list-unit-files --type=service | grep isubata
isubata.golang.service                     disabled
isubata.nodejs.service                     disabled
isubata.perl.service                       disabled
isubata.php.service                        disabled
isubata.python.service                     enabled
isubata.ruby.service                       disabled

# Change the implementation language
$ sudo systemctl stop isubata.python.service
$ sudo systemctl disable isubata.python.service
$ sudo systemctl start isubata.nodejs.service
$ sudo systemctl enable isubata.nodejs.service
Verify it started:
$ service isubata.nodejs status
● isubata.nodejs.service - isucon7 qualifier main application in nodejs
   Loaded: loaded (/etc/systemd/system/isubata.nodejs.service; enabled; vendor preset: enabled)
   Active: active (running) since Sun 2020-07-26 12:24:52 UTC; 2min 59s ago
Measuring bottlenecks
Install monitoring tools
Choose and install any of these tools:
- htop
- dstat
- glances
- netdata
$ sudo apt install htop
$ sudo apt install dstat
$ sudo apt install glances
$ bash <(curl -Ss https://my-netdata.io/kickstart-static64.sh)
Monitoring during benchmark
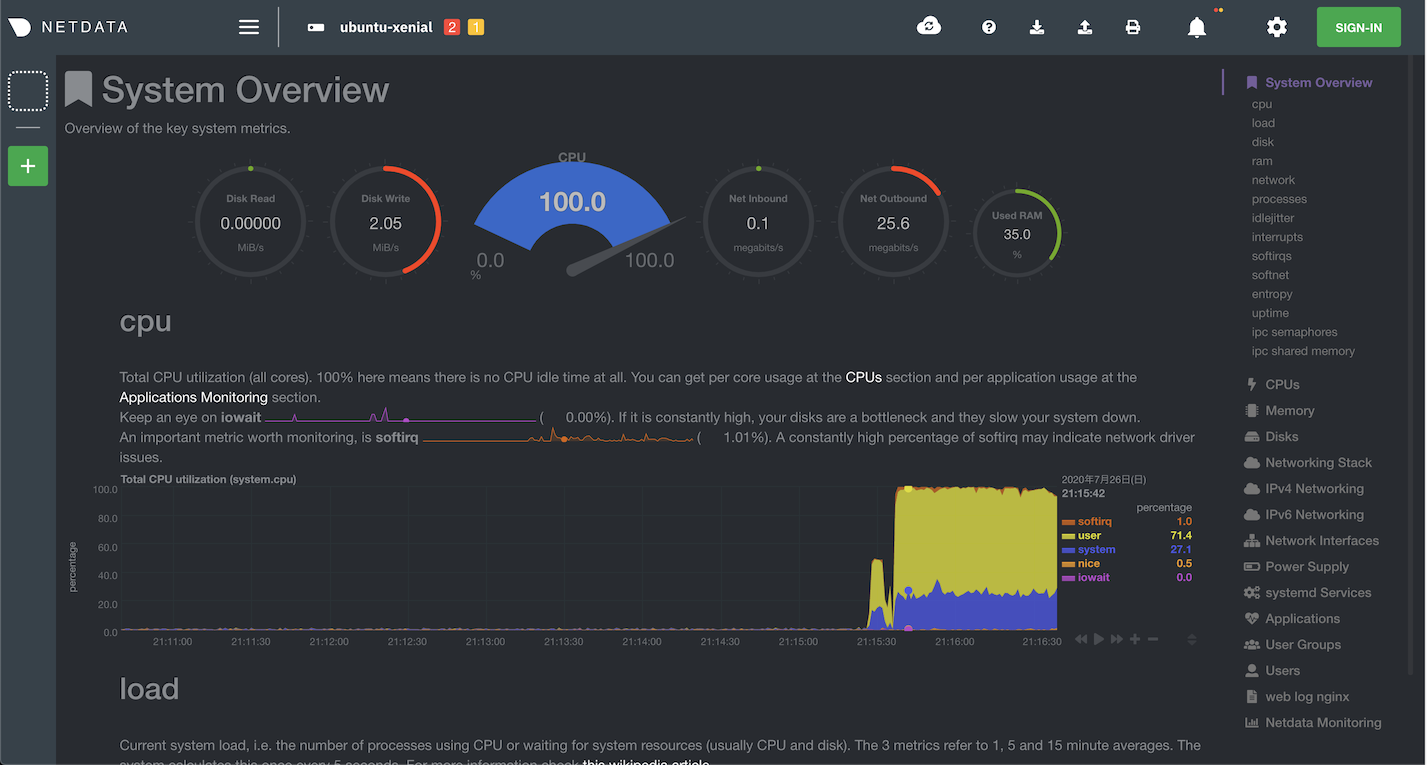
These tools let you visualize CPU, memory, and other resources while the benchmark is running.
glances
$ glances
ubuntu-xenial (Ubuntu 16.04 64bit / Linux 4.4.0-184-generic)                 Uptime: 3:06:11

CPU      99.7%  nice:     0.2%     LOAD    2-core       MEM     53.6%  active:    1.51G
user:    74.7%  irq:      0.0%     1 min:    7.61       total:  1.95G  inactive:   262M
system:  23.1%  iowait:   0.2%     5 min:    6.71       used:   1.05G  buffers:   54.1M
idle:     0.3%  steal:    0.0%     15 min:   3.86       free:    928M  cached:     779M
...
netdata
Access http://
Analyzing access logs with alp
Install alp
$ wget https://github.com/tkuchiki/alp/releases/download/v1.0.3/alp_linux_amd64.zip
$ sudo apt install unzip
$ unzip alp_linux_amd64.zip
$ sudo install ./alp /usr/local/bin
Add alp output format to nginx
$ sudo vi /etc/nginx/nginx.conf
http {
        ...
        log_format ltsv "time:$time_local"
                        "\thost:$remote_addr"
                        "\treq:$request"
                        "\tstatus:$status"
                        "\tmethod:$request_method"
                        "\turi:$request_uri"
                        "\tsize:$body_bytes_sent"
                        "\treqtime:$request_time"
                        "\tapptime:$upstream_response_time"
                        "\tvhost:$host";

        access_log /var/log/nginx/access.log ltsv;

$ sudo rm /var/log/nginx/access.log && sudo systemctl reload nginx
Analyze access logs with alp
After running the benchmark, aggregate the access logs with alp. Looking at the results sorted by total time in descending order, access to /message and /fetch is taking the most time. The responses for images under /icons are also notable.
Hold back the urge to fix things and move on to analyzing MySQL queries.
$ alp ltsv -r --sort sum --file /var/log/nginx/access.log
+-------+-----+-----+-----+-----+-----+--------+------------------------------------------------------+-------+--------+---------+--------+...
| COUNT | 1XX | 2XX | 3XX | 4XX | 5XX | METHOD |                         URI                          |  MIN  |  MAX   |   SUM   |  AVG   |...
+-------+-----+-----+-----+-----+-----+--------+------------------------------------------------------+-------+--------+---------+--------+...
|    90 |   0 |  60 |   0 |  30 |   0 | GET    | /message                                             | 0.002 | 10.216 | 397.354 |  4.415 |...
|    44 |   0 |   7 |   0 |  37 |   0 | GET    | /fetch                                               | 0.002 | 10.085 | 350.770 |  7.972 |...
|    18 |   0 |   5 |   0 |  13 |   0 | GET    | /icons/7598595abd317f5ae637300a27f95e3c700376a7.png  | 0.820 | 10.028 | 143.519 |  7.973 |...
...
MySQL query analysis
Add slow query log output settings, rerun the benchmark, and output the log. If setup is correct, /var/log/mysql/mysql-slow.log will be created.
$ sudo vi /etc/mysql/mysql.conf.d/mysqld.cnf
[mysqld]
slow_query_log = 1
log_slow_queries = /var/log/mysql/mysql-slow.log
long_query_time = 0

$ sudo systemctl restart mysql
$ sudo systemctl restart isubata.nodejs.service
Install pt-query-digest
pt-query-digest is a support tool for aggregating MySQL query logs.
Note: Installing via apt gives an old version with bugs.
Stack Overflow reference
$ wget percona.com/get/percona-toolkit.tar.gz
$ tar xf percona-toolkit.tar.gz
$ cd percona-toolkit-3.2.0
$ perl Makefile.PL && make && sudo make install
$ sudo pt-query-digest --help
View slow query logs
Use pt-query-digest to analyze slow query logs.
It looks like SELECT * FROM image WHERE name = 'c434098fec37fd0d2c1e646d104220f6ffabbea7.png' is taking very long.
$ sudo pt-query-digest --limit 10 /var/log/mysql/mysql-slow.log
# Profile
# Rank Query ID                      Response time  Calls R/Call V/M   Ite
# ==== ============================= ============== ===== ====== ===== ===
#    1 0x086EF2D69E0CA10C16A13978... 989.3391 93.5%   751 1.3174  0.09 SELECT image
#    2 0xB36405B8C0D2F0C74866C96B...  47.8231  4.5%  4012 0.0119  0.02 SELECT message
...
# EXPLAIN /*!50100 PARTITIONS*/
SELECT * FROM image WHERE name = 'c434098fec37fd0d2c1e646d104220f6ffabbea7.png'\G